
Figure 2.
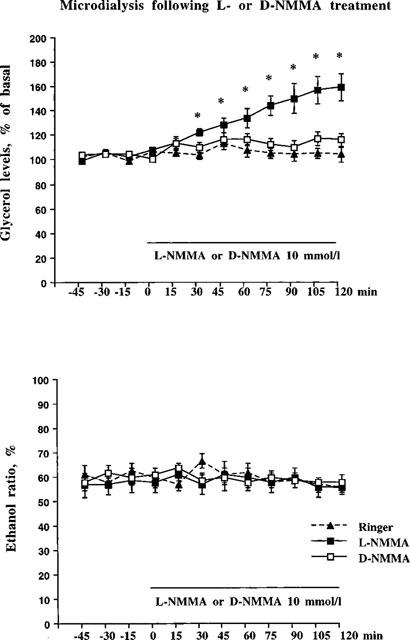
In the top panel subcutaneous adipose tissue microdialysate glycerol levels are shown following a 2 h L-NMMA or D-NMMA treatment. Experimental protocol: 1 h of pre-treatment (the probe were perfused with Ringer-ethanol), 2 h of solvent, L-NMMA (10 mmol l−1) or D-NMMA (10 mmol l−1). L-NMMA or D-NMMA versus solvent were statistically tested using ANOVA, followed by Fisher PLSD-test as post-hoc analysis. *P<0.05. n=8–10 in each group. Mean glycerol levels (μmol l−1) during the pre-treatment period for the different groups were 60±4 (Ringer), 45±4 (L-NMMA) and 47±6 (D-NMMA), respectively. In the lower panel subcutaneous adipose tissue microdialysate ethanol ratio are shown following a 2 h L-NMMA or D-NMMA treatment. No statistical differences were found on ethanol ratio (ANOVA, followed by Fisher PLSD-test as post-hoc). Number of probes=8–10 in each group.