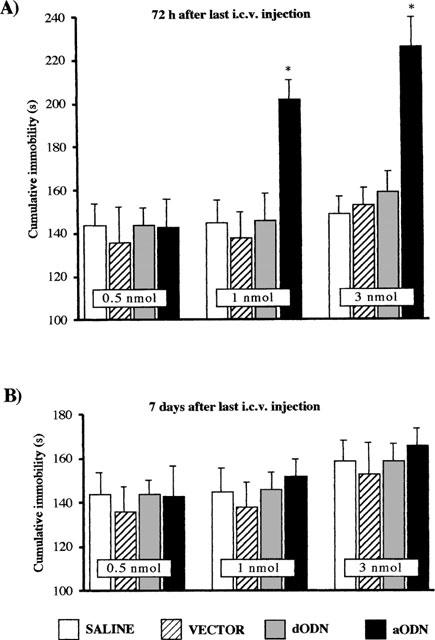
Figure 3.

Effect of mKv1.1 aODN potassium channel in the mouse forced swimming test 72 h (A) and 7 days (B) after the last i.c.v. injection. *P<0.01 versus saline or vector-treated mice (see statistical analysis section). Vertical lines give s.e.mean. The number of mice was between 17–21 mice. See Methods for administration schedule.
