
Figure 2.
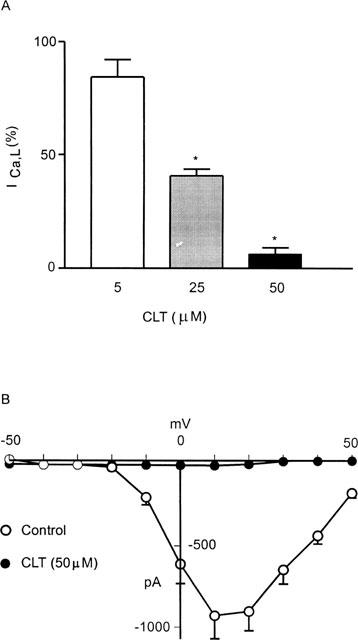
(A) Concentration-dependent inhibition of ICa,L by CLT in ventricular myocytes. n=3 for 5 μM, 4 for 25 μM and 5 for 50 μM CLT. Drug effects shown in this histogram were taken at 5 min post-CLT. Data are shown as ICa,L (%) of respective control values±s.e.mean. * P<0.05 compares to respective control values. (B) Mean current voltage relationship of peak ICa,L obtained from five ventricular myocytes showing the potent inhibition of ICa,L by CLT (50 μM).