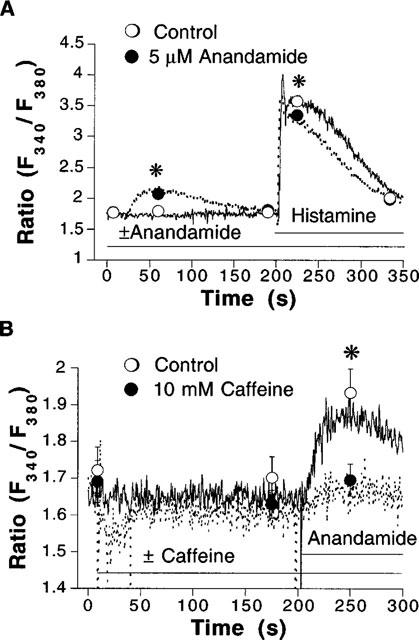
Figure 2.

(A) Representative recordings from fura 2-loaded EA.hy926 endothelial cell suspensions that were stimulated with 100 μM histamine in the absence (continuous lines and open circles, n=4) and in the presence (dotted lines and closed circles, n=5) of 5 μM anandamide, applied as indicated by horizontal bars. Experiments were performed in Ca2+-free physiological salt solution. (B) Recordings obtained in cells that were stimulated with 5 μM anandamide in the absence (continuous lines and open circles, n=7) and in the presence (dotted lines and closed circles, n=7) of caffeine. Experiments were performed in Ca2+-free physiological salt solution. Symbols represent mean±s.e.mean of fluorescence ratio values obtained at indicated times. *P<0.05 between treatments. Error bars not visible when the size of the symbol exceeds the spread of s.e.mean.
