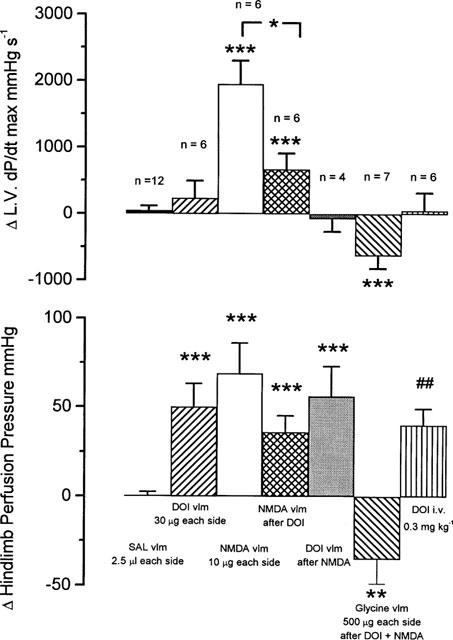
Figure 2.

Anaesthetized cats: histograms showing the change (Δ) in left ventricular (L.V.) dP/dt max (mmHg s−1) and hindlimb perfusion pressure (mmHg) caused by bilateral application on disks of filter paper 3 mm in diameter of sodium chloride (NaCl 154 mM) 2.5 μl each side; DOI 30 μg each side; N-methyl-D-aspartic acid (NMDA) 10 μg each side (these data include data from two animals in which the adrenal glands had been bilaterally ligated); NMDA after DOI; DOI after NMDA; glycine 500 μg each side after the application of DOI and NMDA; and DOI 300 μg kg−1 i.v. Each histogram represents the mean change and the bars show the s.e.mean. Changes caused by the test substances are compared with those caused by sodium chloride solution or as indicated using a Student's unpaired t-test *P<0.05 **P<0.01, ***P<0.001. For i.v. DOI actual values before and after drug were compared using Student's paired t-test. ##P<0.01.
