
Figure 7.

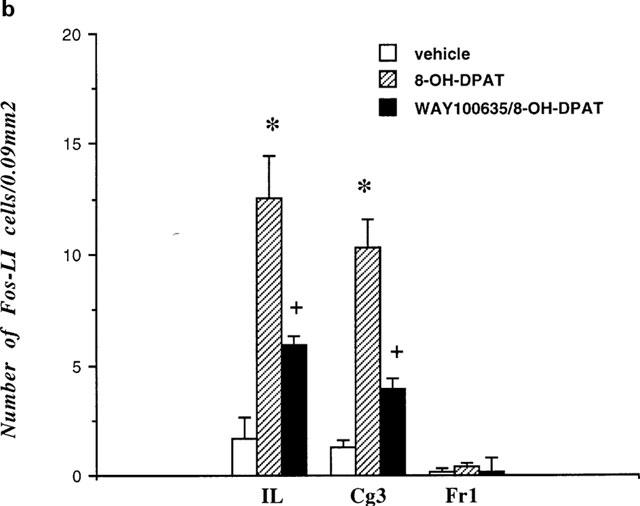
(a) Schematic drawing of a frontal section of the rat brain at anterior +2.7 mm (according to Paxinos & Watson, 1986) illustrating regions of the prefrontal cortex (asterisks) in which the number of Fos-positive neurones were determined. Fos positive neurones were counted in a tissue area of 0.09 mm2 in the frontal cortex area 1 (Fr1), cingulate cortex (Cg3) and infralimbic cortex (IL). The grey area represents part of the mPFC shown on the photomicrographs (Figure 8). (b) Effects of saline (n=5), 8-OH-DPAT (0.1 mg kg−1, s.c.; n=7) and WAY 100635 (1 mg kg−1, s.c.)/8-OH-DPAT (0.1 mg kg−1, s.c.; n=4) on the number of Fos-positive neurones in different areas of the frontal cortex. *P<0.001 compared to vehicle treatment, +P<0.02 compared to 8-OH-DPAT treatment (one-way ANOVA followed by Dunnett t-test).