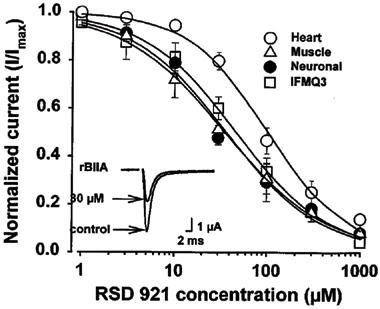
Figure 2.

Concentration-response curves for the effects of RSD 921 on heart (○), skeletal muscle (▵), neuronal (•), and mutant IFMQ3 (□) Na+ channels. Oocytes were injected with Na+ channel RNA and currents were recorded in ND96 using two-electrode voltage clamp, as described in the Methods. Peak Na+ currents, evoked every 6 s, were measured at test potentials that elicited maximum inward current (−10 mV). Peak Na+ currents were measured again after 5 min perfusion of the cell at a flow rate of 1–2 ml min−1 of ND96 containing increasing concentrations of RSD 921. Data points represent the means of at least six individual oocytes, and error bars represent standard deviations. The curves described by the solid lines were fit by the Hill equation as described in the Methods. The inset shows a current trace for the neuronal Na+ channel during a depolarization to −10 mV in the absence and presence of 30 μM RSD 921.
