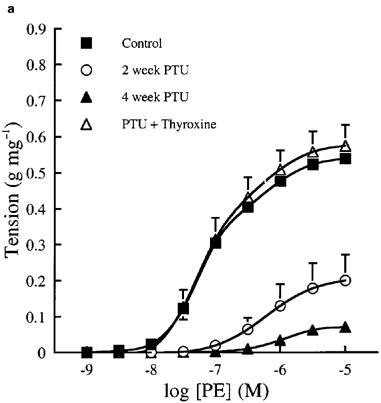
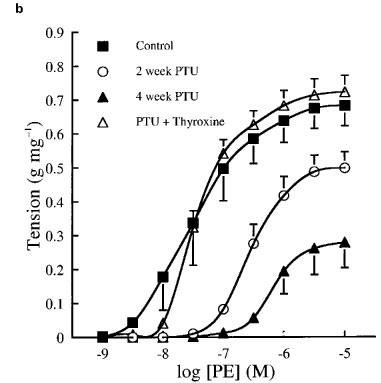
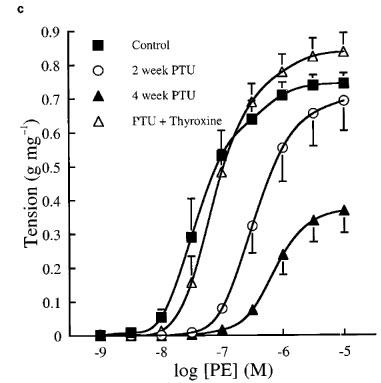
Figure 1.


Cumulative concentration contraction response curves to PE in (a) endothelium-intact, (b) endothelium-denuded and (c) endothelium-intact rat aortic rings in the presence of 0.1 mM L-NOARG. The ordinate scale represents contraction expressed as g tension produced per mg of tissue. Each data point represents the mean±s.e.mean; the s.e.means are only included when they exceed the size of the symbol. The line has been drawn by interpolation through these mean values. The best fit values for EC50, maximum tension and Hill slope were derived by a computerized non-linear curve fitting procedure for each vessel segment and these mean values are presented in Table 1.
