
Figure 1.
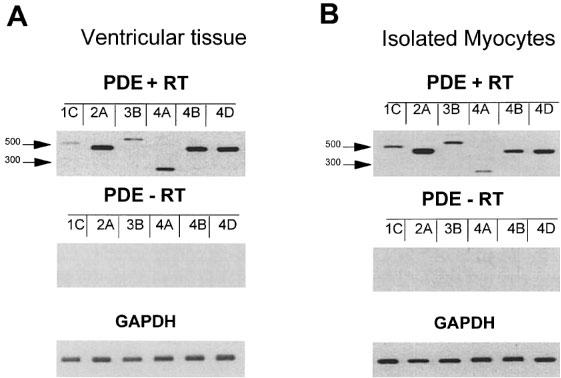
Expression analysis of PDE1, PDE2, PDE3 and PDE4 transcripts in rat ventricle. RT–PCR analysis was performed on mRNA extracted from whole ventricular tissue (A) and isolated ventricular myocytes (B) and in the presence (+RT) or in the absence (−RT) (as a negative control) of the reverse transcriptase. The PCR products were analysed on a 1.7% agarose gel and photographs of the ethidium bromide stained gels are shown. The PCR primers used for this analysis and expected length of the PCR products are described in Methods. Positive controls were performed in a second PCR using rat glyceraldehyde 3-phosphate dehydrogenase primers (GAPDH). Positions of two molecular weight markers are indicated in bp. Note that the PCR procedure was 40 cycles and 35 cycles for isolated myocytes and ventricular tissue respectively. This figure is representative of three separate determinations of the PDE mRNA expressions obtained by RT–PCR.