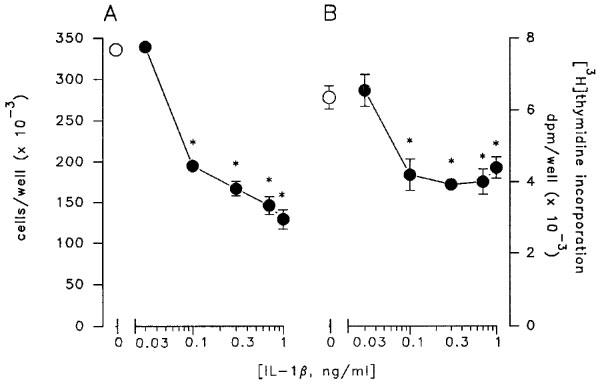
Figure 5.

Concentration-response curve of the inhibitory effect of IL-1β on LNCaP cell growth. Cells were exposed for 48 h to increasing concentrations of the cytokine and counted with a haemocytometer (A) or incubated with [3H]-thymidine during the last 6 h of treatment (B). Data are mean±s.e.mean of 3–5 independent studies and were analysed by one-way ANOVA followed by Newman-Keuls t-test (*P<0.05).
