
Figure 1.
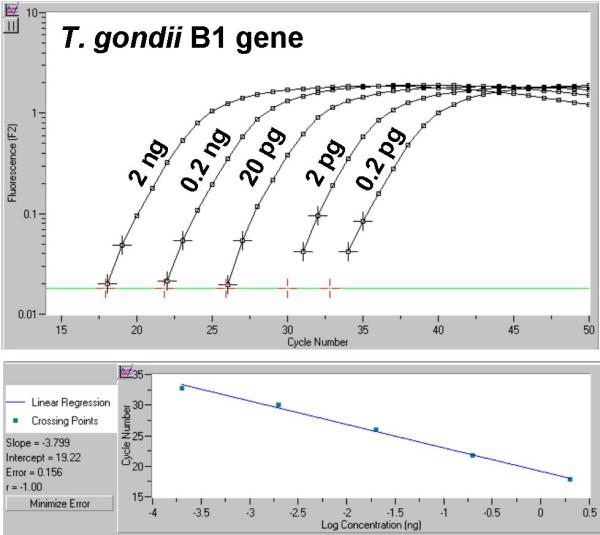
Quantitative analysis of LightCycler results obtained on 10-fold serial dilutions of T. gondii genomic DNA using the B1-specific PCR protocol. The corresponding template DNA concentrations, ranging from 2 ng to 0.2 pg input per 20 μl PCR reaction, are indicated next to the amplicon curves. Based on the slope of the original amplification curves during the log-linear phase determined by two data points, artificial crossing points with the noise band (horizontal line) were determined by the LightCycler software (A). The standard curve represented the linear regression line through the data points on a plot of crossing points (threshold cycle) vs logarithm of standard sample concentration (B). Slope, Y-intercept, mean squared error, and regression coefficient of the standard curve are given.