
Figure 2.
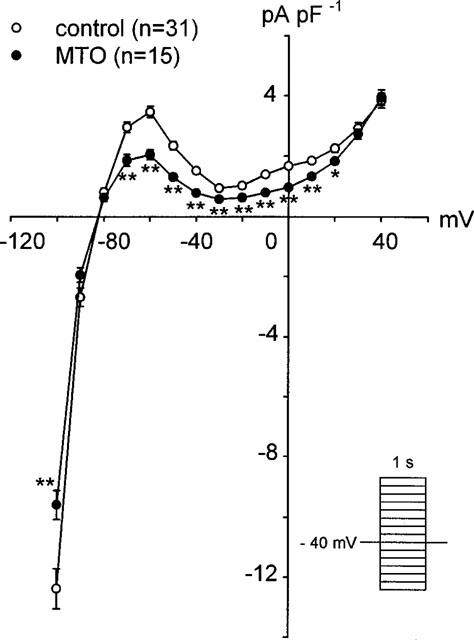
Current-voltage relation of the steady-state K+ currents of guinea-pig ventricular myocytes in the absence (control) and in the presence of 30 μM MTO. The drug effect was measured 1 h after its addition to the cells. Currents were evoked by applying 1-s depolarizing or hyperpolarizing pulses in 10 mV steps from a holding potential of −40 mV every 10 s. The mean current densities are plotted against the respective test potentials. Data from two different cell groups are compared. *P<0.05 and **P<0.01 vs control.