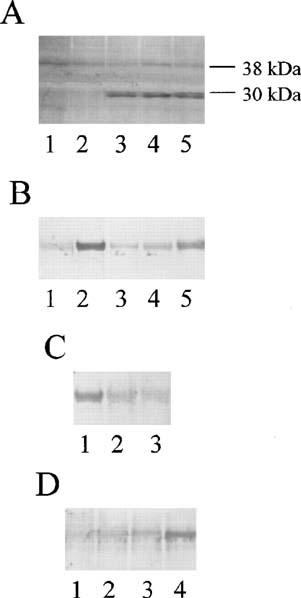
Figure 4.

Nitrotyrosine formation by NO donors and superoxide. Peroxynitrite generation was assessed by monitoring nitrotyrosine formation in (A) Rabbit aorta and (B, C and D) serum albumin. (A) 1, control; 2, NADH (3×10⁻⁴ M); 3, NADH and GSNO (1×10⁻³ M); 4, GSNO, (1×10⁻³ M); 5, GSNO and tiron (1×10² M). (B) Bovine serum albumin was incubated for 10 min with 1, HEPES buffer; 2, SIN-1 (1×10⁻³ M); 3, SIN-1 and oxyhaemoglobin (5×10⁻⁵ M); 4, SIN-1 and SOD (1000 U ml−1); 5, SIN-1, SOD (1000 U ml−1) and GSNO (1×10⁻³ M). (C) Bovine serum albumin and SIN-1 (1×10⁻³ M) was incubated for 10 min with 1, SOD (10 U ml−1); 2, SOD (100 U ml−1); 3, SOD (1000 U ml−1). (D) Bovine serum albumin was incubated for 10 min with 1, HEPES buffer; 2, GSNO (1×10⁻³ M); 3, Pyrogallol (1×10⁻³ M); 4, GSNO and Pyrogallol. Density of bands are shown above each lane. Results are representative of those obtained in three separate experiments.
