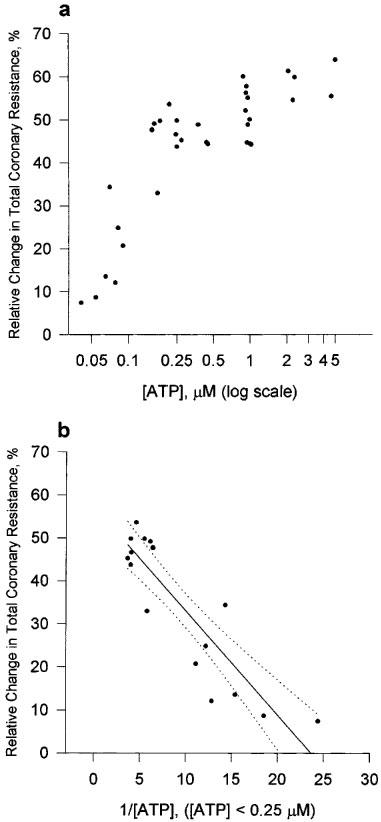
Figure 2.

Dose-response curve for ATP on the isolated working rat heart preparation. (a) The relative change in TCR is plotted against [ATP]. TCR was calculated as (TCRpretreatment−TCRposttreatment)/TCRpretreatment×100%. TCRpretreatment refers to the 15th minute of the control period. TCRposttreatment refers to the 5th minute of the treatment period. (b) Transformed data used to determine the apparent ATP concentration that resulted in a 50% change in TCR. Linear regression analysis gave a straight line with r2=0.7893; b(0)=57.238; b(1)=−2.4175. Dashed lines represent 95% confidence interval.
