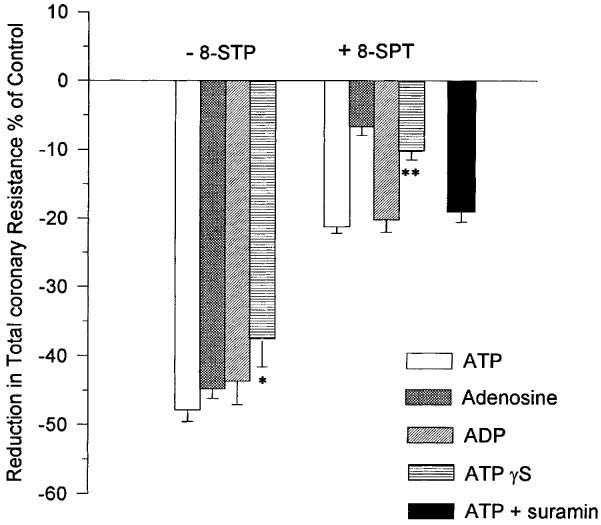
Figure 3.

The influence of ATP, ADP, ATPγS, adenosine and ATP+suramin (nucleotide concentration=0.25 μM) in the presence and absence of the P1 receptor antagonist 8-SPT on TCR. Mean and s.e. mean are plotted, n=5. *Indicates a significant difference (P<0.05) with ATP; **Indicates a significant difference (P<0.05) with ATP and ADP but not with adenosine.
