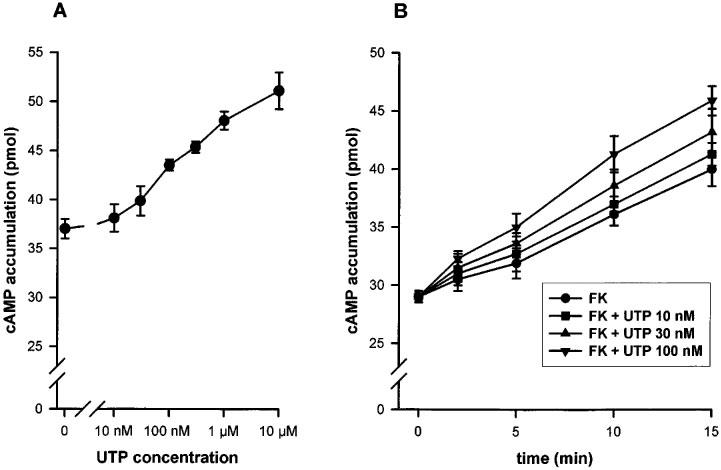
Figure 6.

(A) Concentration-response curve of the UTP effect on cyclic AMP accumulation in 1321N1 cells expressing the human P2Y2 R variant (similar results were observed for the C variant). The P2Y2 expressing 1321N1 cells were stimulated 15 min with increasing concentrations of UTP. (B) Time-course of the UTP effect on cyclic AMP accumulation. 1321N1 cells expressing the R variant were stimulated by low concentrations of UTP (10, 30 or 100 mM) for various periods (2, 5, 10 or 15 min). For both experiments, prior to stimulation, the cells were preincubated 30 min with rolipram 25 μM, then 10 min with FK 1 μM and rolipram 25 μM before the addition of UTP, supplemented by FK and rolipram. The data represent the mean±s.d. of triplicate points and are representative of three independent experiments.
