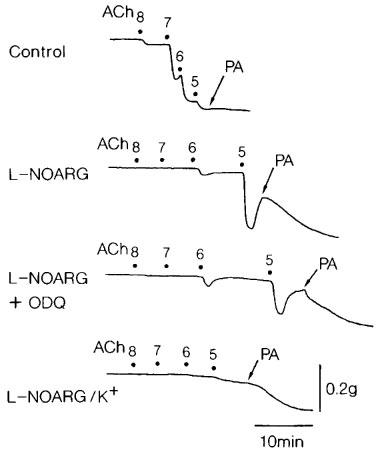
Figure 3.

Tracings of the response to acetylcholine (ACh, 10 nM–10 μM) as affected by L-NOARG (100 μM), L-NOARG plus ODQ (1 μM) and L-NOARG plus ODQ (K+) in a corpus cavernosum strip. The preparation was contracted with phenylephrine in the upper three tracings but with K+ (15 mM) in the bottom tracing. PA represents 0.1 mM papaverine that produced the maximal relaxation. Numbers indicate the concentrations of the drugs in −log[M].
