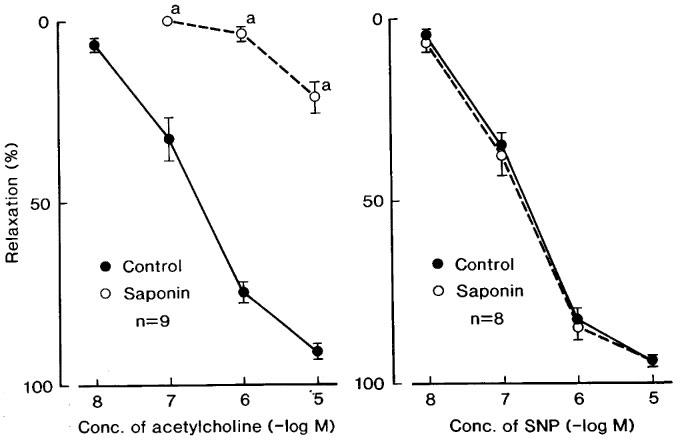
Figure 4.

Concentration-response curves of acetylcholine (left figure) and sodium nitroprusside (SNP) (right) in corpus cavernosum strips before (control) and after treatment with saponin. The strips were contracted with phenylephrine. The ordinate represents relaxations relative to those induced by 0.1 mM papaverine. Significantly different from control, aP<0.001 (unpaired t-test). ‘n' denotes the number of strips from separate dogs. Vertical bars represent s.e.mean.
