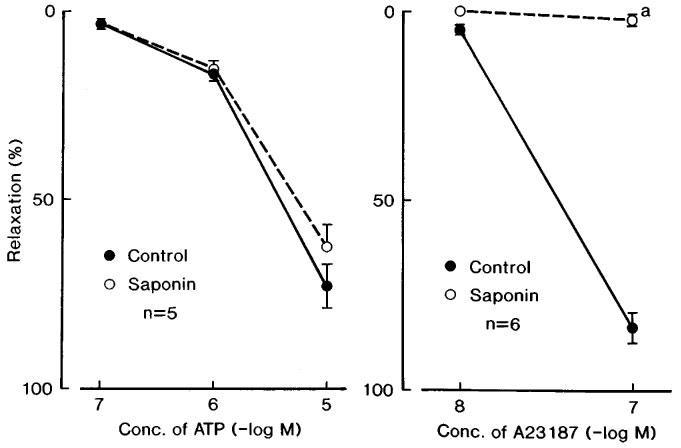
Figure 5.

Concentration-response curves of ATP (left figure) and Ca2+ ionophore A23187 in corpus cavernosum strips before (control) and after treatment with saponin. The strips were contracted with phenylephrine. Significantly different from control, aP<0.001 (unpaired t-test). ‘n' denotes the number of strips from separate dogs. Vertical bars represent s.e.mean.
