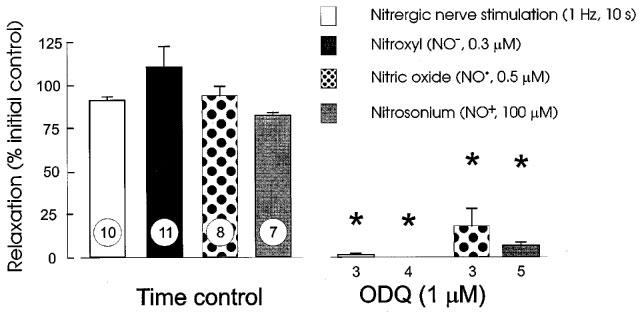
Figure 4.

Blockade of responses to nitrergic nerve stimulation (EFS; 1 Hz for 10 s), Angeli's salt (NO−, 0.3 μM), NO• (0.5 μM) and nitrosonium tetrafluoroborate (NO+; 100 μM) by 1 μM ODQ. Column heights indicate means and I-bars are s.e.means with n indicated by the number at the foot of each column; * indicates significant difference from time control (unpaired t-test, P<0.05).
