
Figure 2.
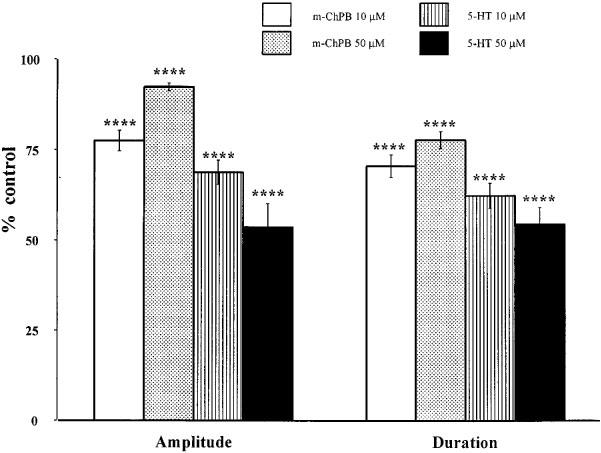
Quantified data for the effect of m-ChPB tested at 10 μM (white columns) and 50 μM (stippled columns) and 5-HT at 10 μM (lined columns) and 50 μM (black columns) on the DR-EPSP amplitude and duration. (Data presented as percentage of control values; ****P<0.001).