
Figure 6.
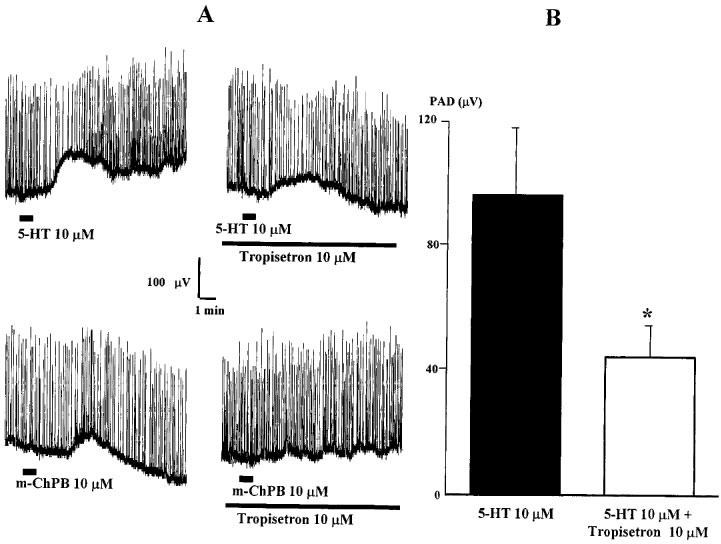
Population PAD generated by 10 μM 5-HT or m-ChPB in the absence or presence of Tropisetron. (A) 10 μM 5-HT (upper traces) and 10 μM m-ChPB (lower traces) produced PAD that was antagonised by Tropisetron (10 μM). (B) Histogram of data for PAD after superfusion of 5-HT in control ACSF (black column) or in 10 μM Tropisetron-containing ACSF (white column) (*P<0.05).