
Figure 3.
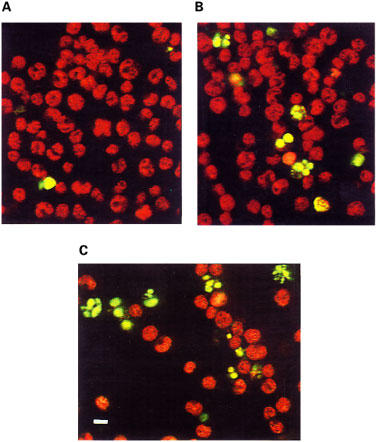
TUNEL analysis of resting and mitogen-activated T-cells upon treatment with ET-18-OCH3. Resting (A) and PHA/IL-2-activated (B and C) T-lymphocytes were treated for 9 h with 10 μM (B) or 25 μM (C) ET-18-OCH3, and analysed by the TUNEL technique through confocal microscopy as described in the Methods section. Data shown are representative of four experiments performed. Bar, 10 μm.