
Figure 9.
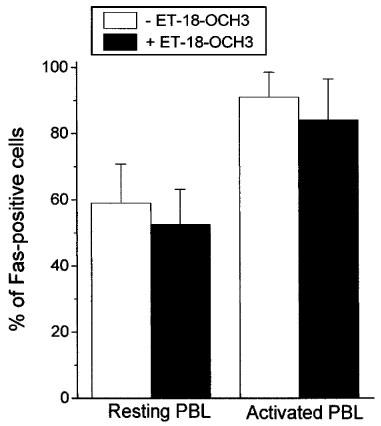
Cell surface expression of Fas in resting and activated T-cells. Resting (Resting PBL) and PHA/IL-2-activated (Activated PBL) T-cells were incubated in the absence (open histograms) and in the presence (solid histograms) of 10 μM ET-18-OCH3 for 24 h, and then were analysed for Fas cell surface expression by flow cytometry as described in the Methods section. The percentages of Fas-positive cells are expressed as mean values±s.e.mean from three independent experiments.