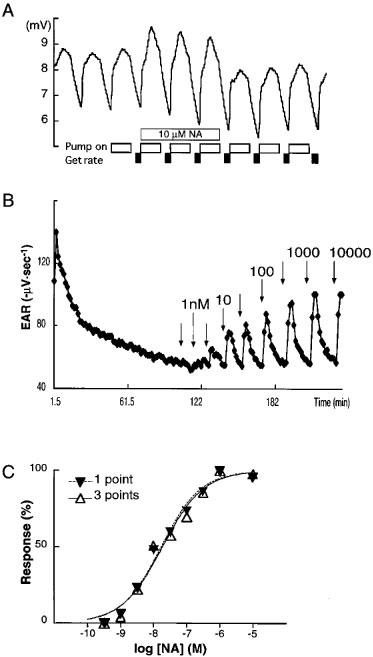
Figure 1.

Measurement of EAR in microphysiometry. This is a representative result of experiments in which the clone aH7 was stimulated with NA. (A) Raw data in microphysiometry were shown. An open box indicates the phase of pump on and a closed box indicates the phase of measuring EAR as described under Methods. Cells were stimulated with 10 μM NA as indicated. (B) Cells were stimulated with increasing doses of NA (0.3 nM to 10 μM) and EARs were monitored as described under Methods. Arrows indicate the addition of NA. (C) Concentration-response curves were compared between the highest recording of three stimulation cycles (1 point) and the sum of all recordings in the three cycles (3 points).
