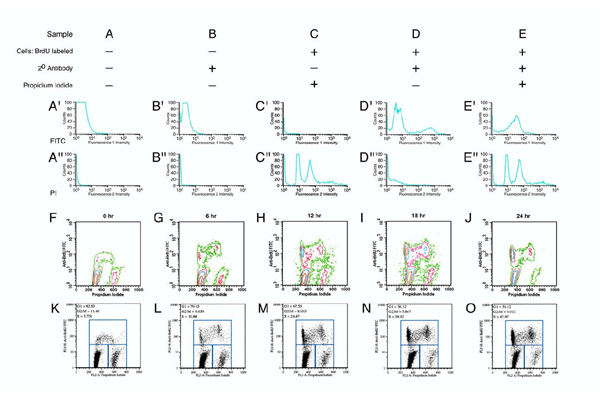
Figure 6.
Cell proliferation assays by Fluorescence Activated Cell Sorting (FACS). Cell proliferation assays were done with BrdU incorporation, which was detected by staining of isolated nuclei with a FITC-fluorochrome-coupled monoclonal antibody. DNA content in nuclei was determined on the basis of fluorescence intensity for Propidium Iodide. The approach was first validated for primary embryonic fibroblast cultures (Panels A-E") and then applied to primary chondrocytes (Panels F-O). Cells were incubated (Panels A, B) in standard medium (DMEM, 10% FCS, high glucose), or in medium with BrdU (Panels C, D, E) for 18 hours, and removed from the dishes by trypsinization. Preparation of nuclei and staining for BrdU and Propidium Iodide were done as described in the methods. The fluorescent signals in samples A and B (Panels A', A", B', B") were very low, as expected for cells without BrdU incorporation and without PI labeling. Sample C showed no green fluorescence (Panel C') due to absence of the BrdU-specific antibody during staining. Yet Propidium Iodide (Panel C") labels two populations of nuclei, those with 1n DNA content (peak at medium red fluorescence intensity) and those with 2n DNA content (high red fluorescence intensity) that are in S-Phase. Sample D was labeled only for BrdU incorporation and shows the majority of nuclei unlabeled (Panel D; low green fluorescence intensity) while a smaller fraction incorporated BrdU (Panel D', high green fluorescence intensity). No signal for DNA content was obtained (Panel D") consistent with absence of PI. Sample E was double-labeled and showed signal for both BrdU (Panel E') and PI (Panel E"). Panels F-O: Cell cycle analysis of primary rib chondrocytes incubated after 72 hours of culture with BrdU for various length of time. Panels F-J: Contour plots display fluorescence intensity for BrdU incorporation (Y-axis) and DNA content (X-axis), with contours representing increasingly higher number of cells with a given fluorescence intensity (orange, highest cell number; green lowest cell number). DNA content and BrdU incorporation increase with DNA synthesis, and DNA content is reduced by half at cell division. Cell that recently underwent DNA synthesis are intensely labeled for BrdU (FITC, Y-axis), and may have 2n DNA content (high Propidium Iodide, X-axis) before, and 1n DNA content (low Propidium Iodide) after cell division. The proportion of cells in the BrdUhi PIlow group will increase with multiple cell divisions. Panels K-O: Dot plot representation of the same data with gating to quantitate fractions of cells in each group: cells with high intensity for BrdU-staining are in S-phase, cells with high Propidium Iodide but low BrdU-staining intensity are in G2/M-phase, and cells low for both Propidium Iodide and BrdU-staining are in G1 phase of the cell cycle.

