
Figure 5.
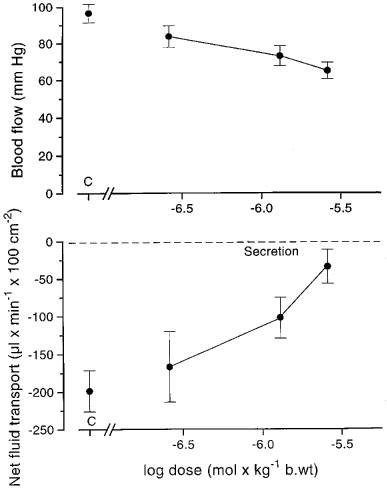
Dose-response curves for R-felodipine given i.v. with regard to the effects on arterial pressure (upper panel) and on net fluid secretion caused by cholera toxin (lower panel; gravimetric technique). C: control recording. n=7. Means±s.e.mean.