
Figure 3.
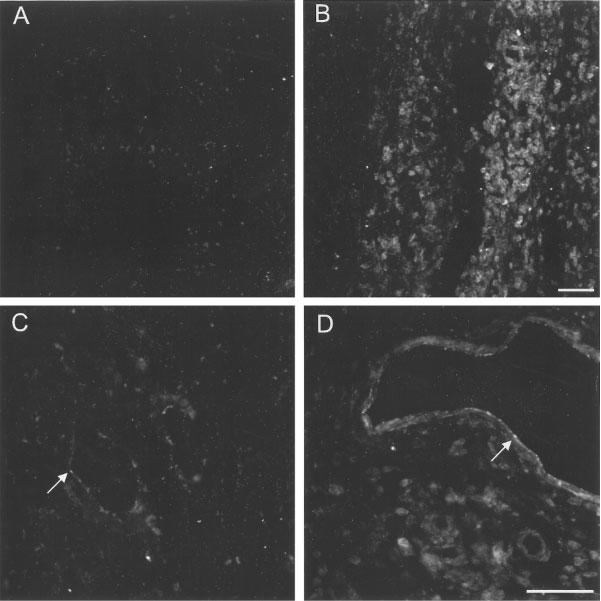
Fluorescence micrographs of PAR2-immunoreactivity in the rat paw from animals injected 6 h earlier with a control peptide (LS-NH2, A and C) and paws injected with a PAR2AP (tc-NH2, B and D). (A) Subdermis from the control paw showing little or no specific labelling. (B) In paws injected with the PAR2AP, there was an extensive infiltration of immunoreactive cells and considerable oedema. (C) On the endothelium of some blood vessels of control tissues (arrow) there was faint PAR2-immunoreactivity. (D) In PAR2AP-treated paws, increased intensity of PAR2-immunoreactivity was found on the endothelium of some blood vessels (mostly venules, arrow). Scale bars: 50 μm. The scale bar in B is for A and B, and the bar in D is for C and D.