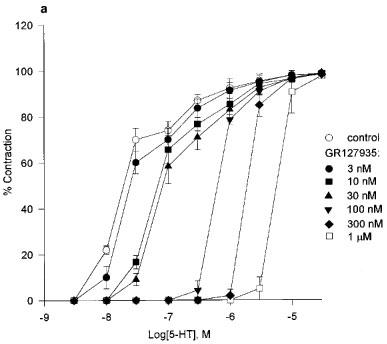
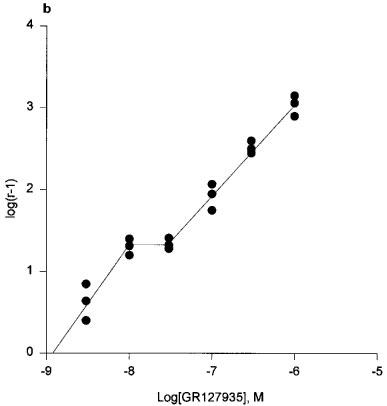
Figure 3.


(a) Cumulative concentration-response curves to 5-HT in the presence of GR127935 (3 nM–1 μM). Each point represents the arithmetic mean±s.e.mean. of n=5 experimental determinations. (b) Schild plot constructed with the concentration-ratios from individual experiments (n=3). The sets of points at the point of inflection are joined to illustrate the ‘plateau'.
