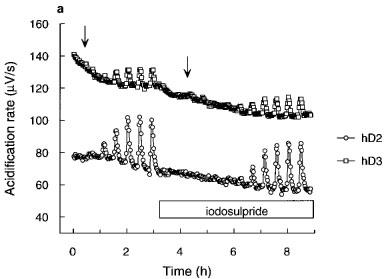
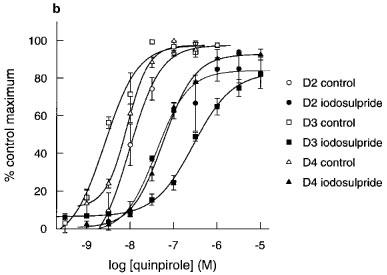
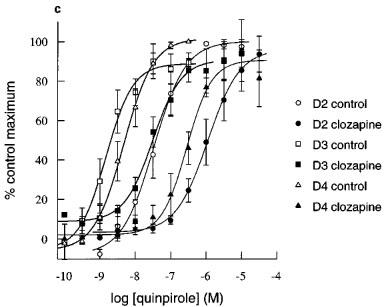
Figure 5.


Apparent pA2 determinations for iodosulpride and clozapine in hD2, hD3 or hD4 receptor clones. (a) Representative acidification rate trace showing the effect of iodosulpride (3 nM for the hD2 cells and 300 nM for the hD3 cells) on quinpirole-induced increases in acidification rate. The start of each quinpirole concentration-response curve is indicated by the arrows. hD4 trace omitted for clarity. Rightward shifts (closed symbols) of agonist responses (open symbols) by (b) iodosulpride (3, 300 and 3000 nM for hD2, hD3 and hD4 clones respectively) and (c) clozapine (3000 nM for all clones).
