
Figure 1.
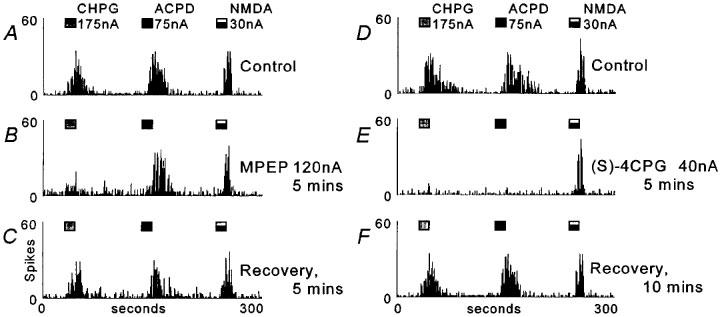
Peristimulus time histograms (PSTHs) showing responses of a thalamic neurone to iontophoretically applied CHPG, ACPD and NMDA. Each PSTH shows action potentials (‘spikes') counted into successive 1000 ms epochs, agonists were applied as indicated by the marker bars above the records. (A) Control responses. (B) Responses during the co-application of MPEP (note the selective reduction of the CHPG response). (C) Recovery following termination of the MPEP ejection. (D) Control responses. (E) Reduction of both CHPG and ACPD responses during co-application of (S)-4CPG. (F) Recovery following termination of (S)-4CPG ejection.