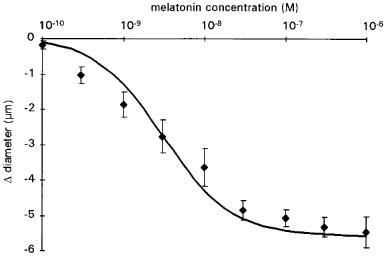
Figure 1.

Cumulative concentration-response curve for melatonin. Results are expressed as change in diameter from baseline. Values are means±s.e.mean; n=8. The sigmoid curve was calculated as the average of the individual curves obtained by least squares analysis of each data set (see Methods).
