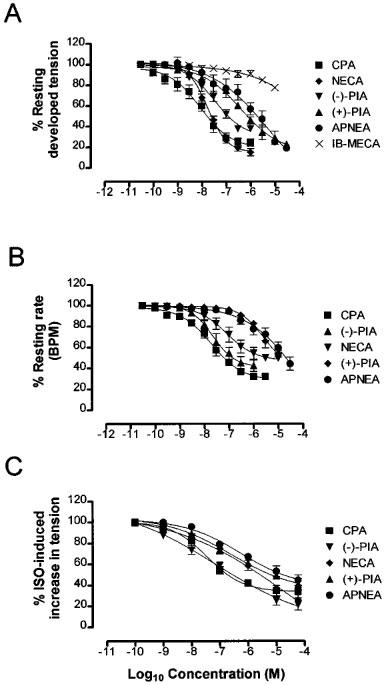
Figure 1.

Mean concentration-response curves (n⩾4) for the inhibition of (A) left atrial tension, (B) right atrial rate, (C) ISO-stimulated increase in papillary muscle tension by CPA (▪), (−)-PIA (▾), NECA (⧫), (+)-PIA (▴), APNEA (•) and IB-MECA (X). Each point is the mean reduction of tension or rate. Vertical bars represent the s.e.mean, their absence indicating they lie within the symbol.
