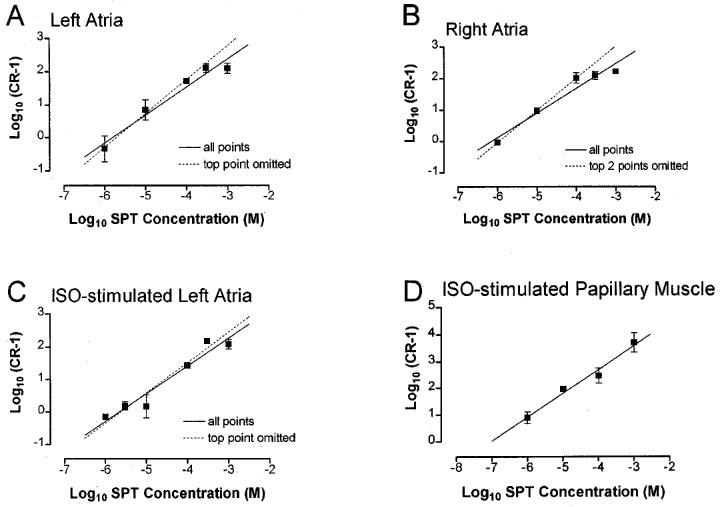
Figure 3.

Schild plots for the antagonism of CPA by 8-SPT in (A) left atria, (B) right atria, (C) ISO-stimulated left atria, (D) ISO-stimulated papillary muscle. Mean (n>4) concentration-ratio (CR) for the shift of individual concentration-response curves in the presence of 8-SPT relative to the mean curve in its absence are plotted as log (CR-1) against log concentration (M) of 8-SPT. Vertical bars represent s.e.mean, their absence indicating that they lie within the symbol. Linear regression for all points are indicated by solid lines. Where the higher concentrations appear to deviate from this line, further regression lines are shown (dashed lines).
