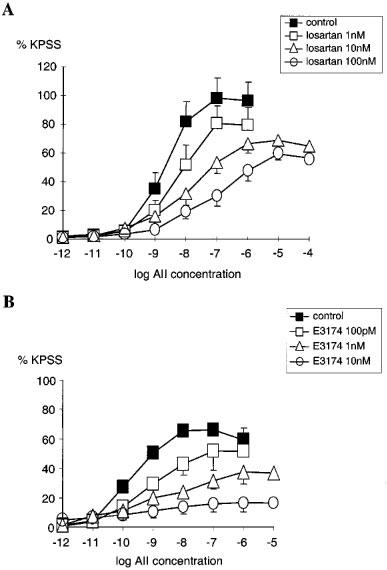
Figure 2.

(A) Comparison of the cumulative concentration-response relationships for angiotensin II (AII 1 pM–100 μM) in PSSK (10.6 mM KCl) before (control (▪), n=5) and after exposure to losartan; (1 nM (□), n=7), (10 nM (▵), n=7), (100 nM (○), n=6). (B) Comparison of the cumulative concentration-response relationships for angiotensin II (AII 1 pM–10 μM) in PSSK before (control (▪), n=4) and after exposure to E-3174; (100 pM (□), n=4), (1 nM (▵), n=4), (10 nM (○), n=4). Points represent mean±s.e.mean of per cent response to KPSS.
