
Figure 8.
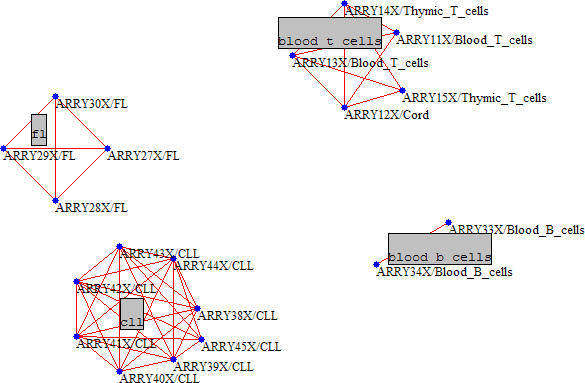
Clustering of the lymphoma samples with Tcor = 0.60 and Tcurv = 0.30. Each cluster is associated with a cell type indicated in the grey boxes
Official websites use .gov
A
.gov website belongs to an official
government organization in the United States.
Secure .gov websites use HTTPS
A lock (
) or https:// means you've safely
connected to the .gov website. Share sensitive
information only on official, secure websites.
Clustering of the lymphoma samples with Tcor = 0.60 and Tcurv = 0.30. Each cluster is associated with a cell type indicated in the grey boxes