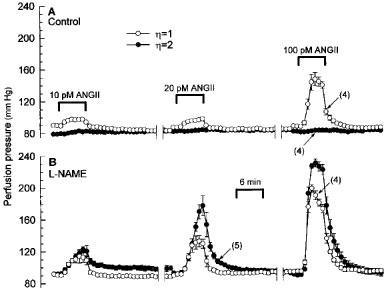
Figure 2.

Changes in perfusion pressure depicting the vasoconstrictor effects of 10, 20, and 100 pM ANGII in isolated kidneys perfused at constant flow with low or high viscosity perfusate in the absence (A) or presence of 100 μM L-NAME (B). Pressure values are means±s.e.mean for the number of kidney preparations indicated in parentheses.
