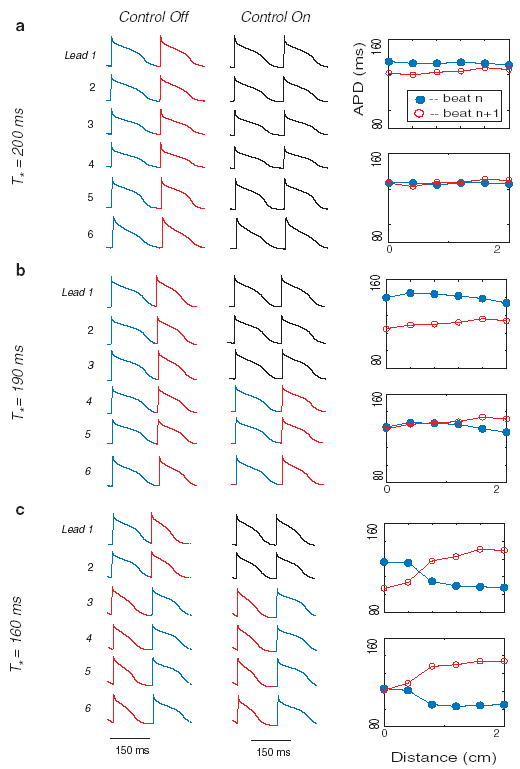
FIG. 1.

(color). Data from two consecutive action potentials recorded from 6 microelectrodes spaced along the length of a Purkinje fiber (Lead 1 is proximal; Lead 6 is distal) in one representative control experiment. Stimulation was applied to the proximal end of the fiber near microelectrode 1 (x = 0 cm). For each of the three rows [(a), (b), and (c)]: (1) T* is shown on the left, (2) membrane potential vs time for microelectrodes 1 through 6 (which correspond to x = 0 and 2 cm, respectively) are shown in the left column (before control) and middle column (during control), and (3) the right column shows APD values computed from the six microelectrodes for the same alternate beats before (top panels) and during (bottom panels) control. During control, stimulation was adapted according to Eq. (1). In the middle column, action potentials for which control failed to eliminate alternans are shown in red and blue, while those in which alternans was suppressed are shown in black.
