
FIG. 3.
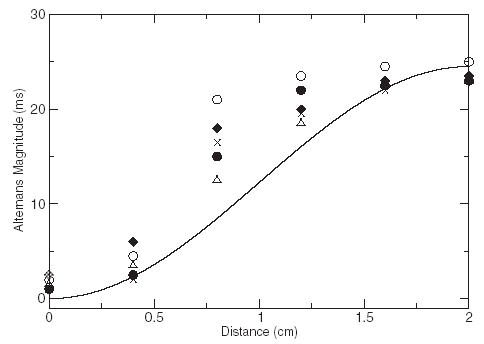
A quantitative comparison of a(x) corresponding to Eq. (3) (solid curve) and five control trials (symbols). For the control-trial data, the APD values for consecutive beats were subtracted and divided by two for each of the six spatial electrodes.