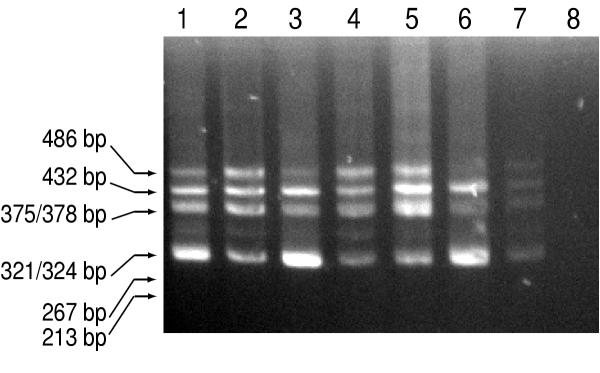
Figure 2.
RT-PCR analysis demonstrating multiple Opa1 transcripts in mouse tissues. Use of ME3S and MK5bAS primers resulted in the amplification of 6 distinct fragments, the size of which is indicated on the left. RT-PCR was performed on mouse lung (lane 1), kidney (lane 2), brain (lane 3), liver (lane 4), testis (lane 5), retina (lane 6) spleen (lane 7) and H2O (lane 8).

