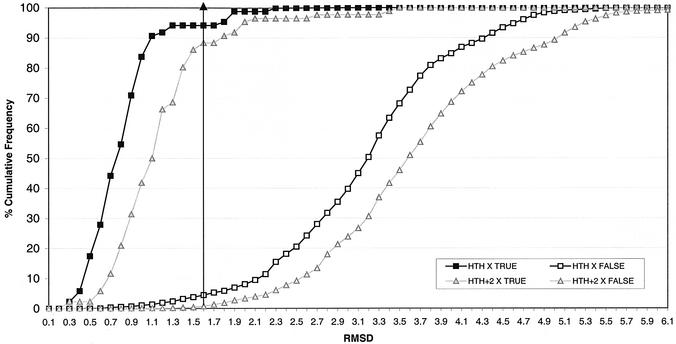
Figure 5.
Cumulative frequency histogram showing the distribution of rmsd values resulting from a scan of seven HTH templates against 84 non-identical HTH proteins (HTH X TRUE) and 8266 PDB proteins (excluding known HTH proteins) (HTH X FALSE), using the original templates (not extended) and using +2 residue extended templates. The points of the distributions for the original templates are shown with squares and for the extended templates as triangles. The maximum rmsd shown is 6.1 Å.

