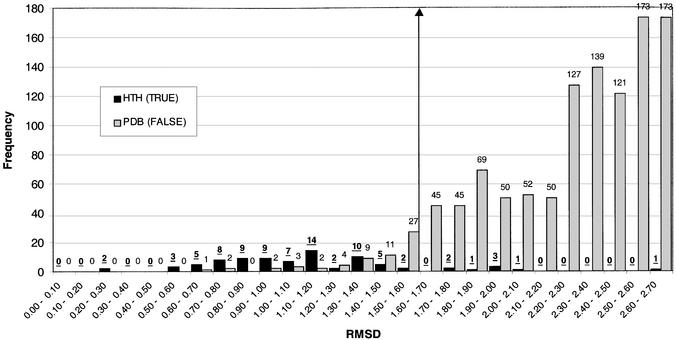
Figure 6.
Frequency histogram showing the distribution of rmsd values resulting from a scan of seven HTH templates against 86 HTH proteins (HTH X HTH) and 8264 PDB proteins (excluding known HTH proteins) (HTH X FALSE). The HTH X HTH distribution is shown in black and the HTH X FALSE distribution is shown in grey. The maximum rmsd shown is 2.7 Å. A threshold value is indicated at 1.6 Å, below which a protein is predicted to contain a DNA-binding HTH motif.

