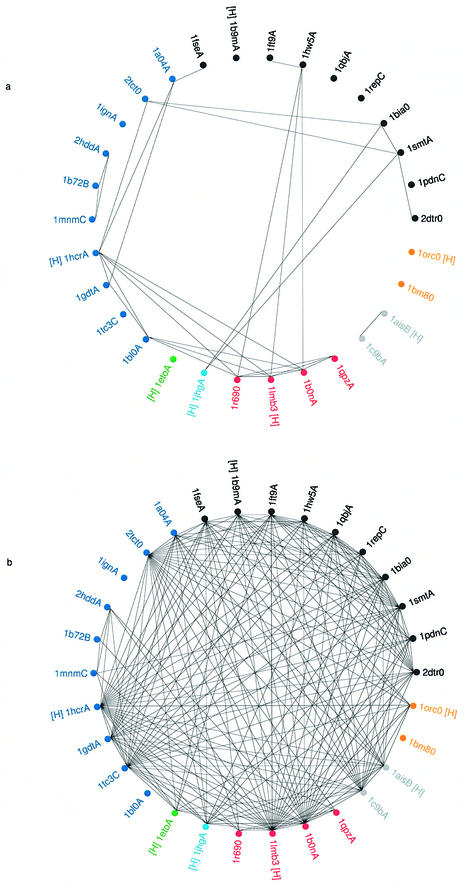
Figure 8.
(Previous page) Wheel diagrams depicting the identification of HTH motifs within a set of 30 sequence representatives. The PDB codes of the 30 proteins (identified in Table 2) are shown clustered into homologous families and the PDB codes in each family are shown in a different colour. The HREP from each family is indicated by a [H] printed next to each PDB code. Within each family the members are clustered according to CATH number (to the S-level) except where SREP proteins belong to the same Pfam family and are represented by the same HMM. In such cases the PDB codes sharing the same HMM are shown clustered together. (a) HTH identification using full sequence HMMs. A line joining two PDB codes indicates the successful match of one protein’s HMM against the sequence of the second protein. A successful match was taken as a HMM matching a representative sequence with an E value of <0.01. (b) HTH identification using structural templates. A line joining two PDB codes indicates the successful match of one structure’s template against the structure of the second protein. A successful match was taken as one where a maximal superposition gave a rmsd <1.6 Å.

