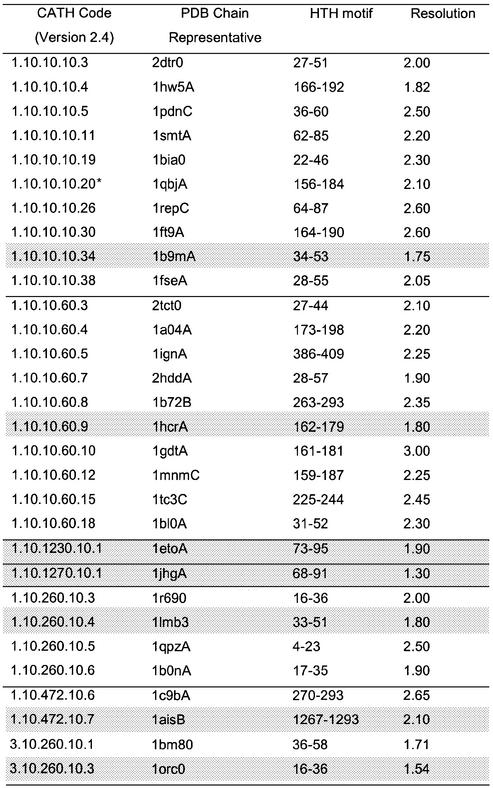
Table 2. The 84 HTH proteins were clustered in 29 sequence families using CATH numbers.
For each family a representative with the best resolution was selected (denoted a SREP). The location of the HTH motif in each SREP (in terms of PDB residue number range) is shown in column 3. An additional sequence family was identified in a second pass of the data and this is indicated by *. The proteins are ordered by CATH number, and each fold family is separated by a line. The seven non-homologous HTH proteins (HREPs) (one from each fold family) are indicated in grey.

