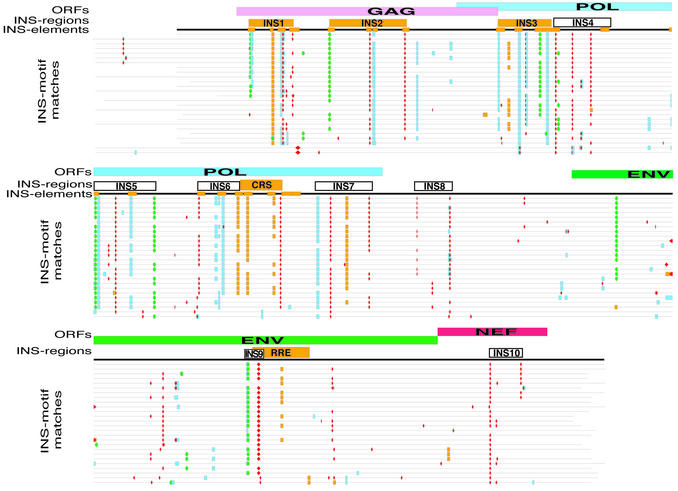
Figure 4.
Comparative mapping of INS regions and motifs in 26 full-length HIV-1 proviral sequences. In this graphical representation of the alignment of 26 HIV-1 full-length proviral genome sequences, the top line illustrates the organization of the HIV-1 genome (ORFs, line 1). Line 2 shows the localization of the INS regions (rectangles), with the known regions marked in orange and the predicted regions uncolored. Line 3 shows the positions of the INS elements (orange boxes) in the HIV-1 HXB2 genome. INS elements were identified by loss of Rev-dependent expression after mutation (27). The lines below represent the following individual HIV-1 sequences (listed from top to bottom, with the corresponding clades indicated in parentheses): hxb2r (B), lw123 (B), 3202a12 (B), 3202a21 (B), mn (B), cam1 (B), th475a (B), bcsg3 (B), lai (B), weau160 (B), han (B), d31 (B), jrcsf (B), jrfl (B), manc (B), oyi (B), ny5cg (B), rf (B), ndk (D), z2z6 (D), eli (D), u455 (A), mal (ADI), ibng (AG), mvp5180 (O) and ant70 (O). Different geometrical shapes and colors indicate matches to the INS matrices (INS motifs). INS motifs for INS-A are marked as red diamonds, for INS-B as filled skyblue squares, for INS-MC as green circles, and for INS-MD as orange boxes. Since INS elements and INS regions are functional on the mRNA level only the sense strand (plus strand) is shown. Open boxes below the aligned sequences indicate the newly predicted INS regions (INS4, INS5, INS6, INS7, INS8, INS9, INS10). A complete and more detailed version of this Figure is available on our homepage (www.gsf.de/biodv/).

