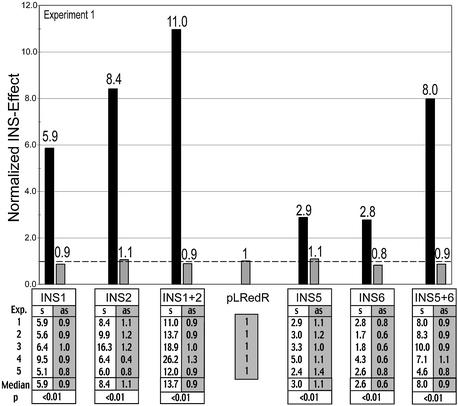
Figure 7.
Inhibitory effects of known and predicted INS regions. To analyze inhibitory activity of known and predicted INS regions of the HIV-1 genome, cells were transfected in parallel with various reporter plasmids containing INS regions or with the pLRedR control plasmid, which lacks INS (plasmids shown in Fig. 5). Flow cytometry was used to determine the ratio of green to red fluorescence (detailed in Materials and Methods). For each INS-bearing construct, this ratio was normalized to the value of pLRedR, which was set to 1. Inhibitory activity was evaluated for the known INS regions, INS1 and INS2, individually and in combination (INS1+2) (left side) and similarly for the newly predicted INS region candidates (INS5 and INS6) and their combination (right side). All INS regions were analyzed in sense (black bars, s) and antisense orientation (gray bars, as). FACS data were obtained from five independent experiments, all of which are shown in the table below the graph. The statistical significance of the difference between sense and antisense was determined as detailed in Material and Methods (Mann–Whitney non-parametric test) and is given below the table. The graph shows the values of experiment 1.

