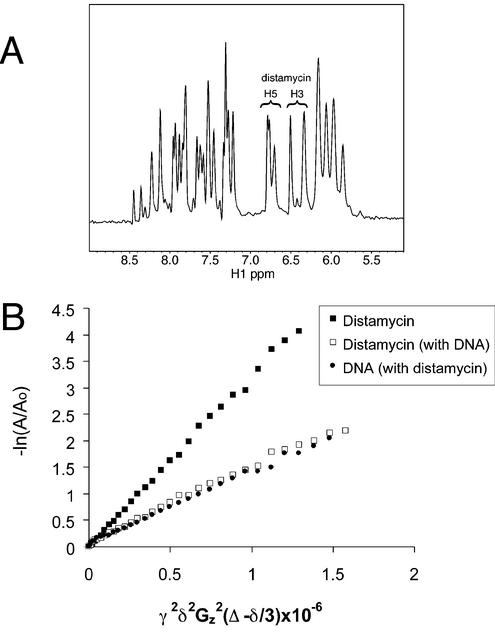
Figure 3.
NMR characterization of the distamycin-[TAGGGTTA]4 complex. (A) 1D proton NMR spectra of the [TAGGGTTA]4 G4 DNA with 4 equivalents of distamycin. The distamycin signals marked are the pyrrole H5 and H3 protons. (B) NMR diffusion measurements. Distamycin alone (filled square), parallel G4 [TAGGGTTA]4 DNA in complex with distamycin (open square) and distamycin in the presence of DNA (filled circle) (4:1 distamycin:G4 DNA molecule). The diffusion coefficient is the slope; γ, gyromagnetic ratio (hydrogen); δ, duration of gradient pulse; Gz, gradient amplitude; Δ, delay during which molecule diffuses; A, peak volume; Ao, initial peak volume. Samples were prepared in D2O, 150 mM KCl, 25 mM potassium phosphate, pH 7.0, 2 mM d-EDTA and the NMR data were collected at 35°C.

