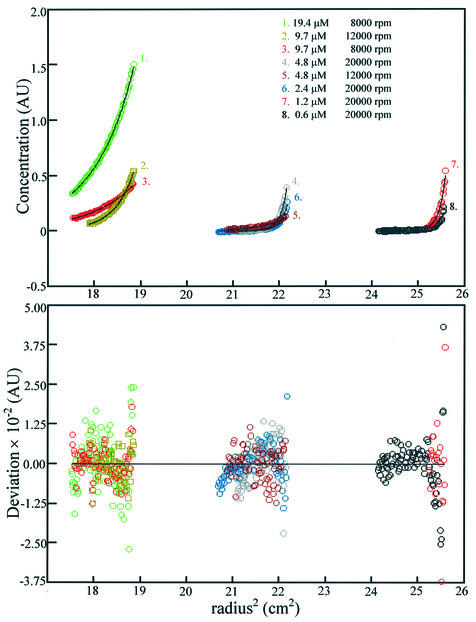
Figure 3.
Sedimentation equilibrium. The top graph shows the sedimentation equilibrium data for the methyltransferase at a series of different concentrations and rotor speeds. Each data set has been fitted with a global model to describe the data and is shown by the black line, with the residuals to the fit plotted below. The model is of two heterodimers of 85 kDa self-associating to form a tetramer of 170 kDa.

