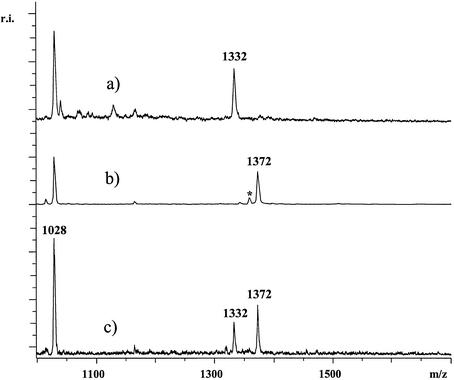
Figure 3.
For the SNP IVS2+691 of the OPRM1 gene primer 5′-GGTGTTAATACTGCCATTTTGCTLpt AptTptT was used. Respective products were pAptTptTpt[G/C] with masses 1372 and 1332 Da. Trace (a) shows the analysis of a DNA homozygous for A while in trace (b) the analysis of DNA homozygous for G is shown. In (c) the analysis of heterozygous DNA is displayed. At 1028 Da, residual primer of the extension reaction is observed. In trace (b) at 1358 Da a very small signal deriving from under-alkylated products was observed (signal indicated with an asterisk). The spectra were not smoothed or otherwise manipulated.

