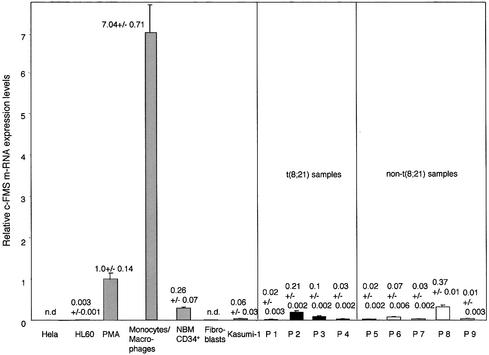
Fig. 1. Kasumi-1 cells and leukaemic blast cells from leukaemia patients express low levels of c-FMS mRNA compared with induced HL60 cells and primary cells (monocytes/macrophages and NBM CD34+ cells). Relative mRNA expression levels in the indicated cell types were measured by real-time PCR as described in Materials and methods. n.d., not detectable. The numbers indicate average relative mRNA levels from at least two independent RNA preparations and/or three independent real-time PCR experiments.

An official website of the United States government
Here's how you know
Official websites use .gov
A
.gov website belongs to an official
government organization in the United States.
Secure .gov websites use HTTPS
A lock (
) or https:// means you've safely
connected to the .gov website. Share sensitive
information only on official, secure websites.
